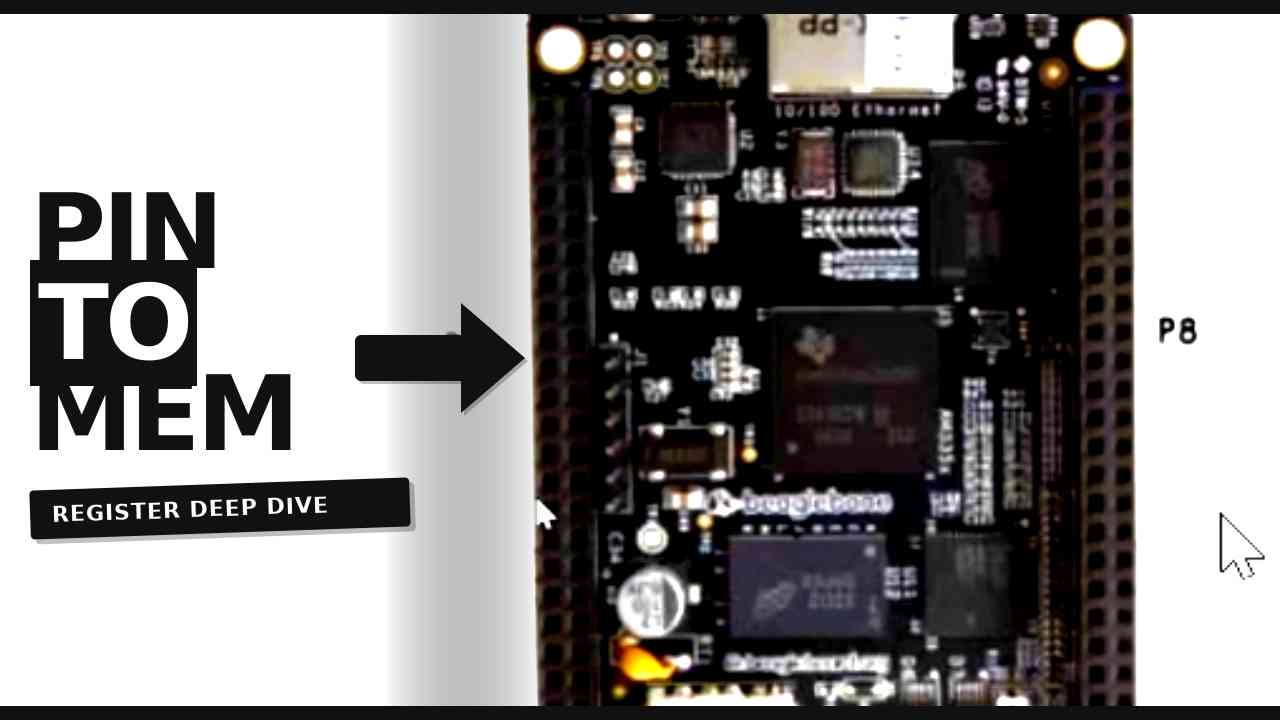
Why I Started Using This Tool
I kept running into the same wall on the BeagleBone Black: I knew which physical pin I wanted to use (say, P9_12), but translating that silkscreen label into something the Linux kernel actually understood — a gpiochip and line number — felt like guesswork. Datasheet math got me close, but "close" isn't good enough when you're toggling real hardware. I needed a repeatable, verifiable process instead of hand-calculated assumptions.
What It Does
At its core, this is a debugging workflow built on two Linux tools: gpioinfo and
the AM335x pinmux debugfs interface. Together they let you go from a header pin label all the
way down to the exact register bit controlling that pin's behavior.
- gpioinfo — instantly maps a physical header pin to its gpiochip/line number, and conveniently prints the header label as the line name on this kernel, so you don't have to guess.
- /sys/kernel/debug/pinctrl/.../pins — surfaces the live pad configuration register address and current value for every pin on the SoC.
- Manual bit decoding — once you have the register value, breaking it down against the AM335x conf register layout tells you exactly how a pin is muxed (GPIO vs. peripheral function), whether pull-up/down is active, and whether the input buffer is enabled.
The Full Flow Path
That's the full chain — five hops from the physical pin to the raw byte sitting in memory:
- P9_12 — the silkscreen label on the header, meaningless to the kernel on its own.
gpioinforesolves it to gpiochip0, line 28 — this is the step that removes guesswork, since hand-calculating bank/offset from the datasheet is easy to get backwards.- Line 28 corresponds to offset 28 in the
gpio-0-31pin range exposed by thepinctrl-singledriver, which the debugfspinsfile reports as pin 30 (PIN30). - That pin entry gives you the actual pad config register address:
0x44e10878— this is a real memory-mapped address the AM335x SoC exposes for controlling that pin's mux mode, pull resistor, and input buffer. - Reading that address gives the current value,
0x37— the raw byte that then gets bit-decoded (mode, pull enable, pull type, input buffer).
My Honest Pros & Cons
✅ What I Love
gpioinforemoves almost all the ambiguity — silkscreen-to-bank mapping by hand is easy to get backwards, and this tool just tells you.- The debugfs
pinsinterface gives you ground truth register state, not just what the datasheet says should happen. - Once you've done this walkthrough once, decoding any other pin becomes fast and mechanical.
❌ What Could Be Better
- Requires debugfs to be mounted and accessible, which isn't always the case on locked-down or production kernels.
- Manual bit decoding is still tedious and error-prone if you're not careful with the AM335x conf register layout.
Pricing: Is It Worth It?
This isn't a paid tool — gpioinfo and pinctrl debugfs are free, built into the
Linux kernel and standard userspace tooling. The only "cost" is the time it takes to learn the
workflow.
My take: Free, built-in, and more reliable than hand-calculated datasheet math — there's no reason not to use it.
Final Verdict
If you're doing any GPIO-level work on a BeagleBone Black (or any AM335x-based board) running Linux, this workflow should be your default first step before writing a single line of driver or application code. Skip it only if you're working bare-metal without a Linux kernel involved — in that case, you're reading registers a different way entirely.