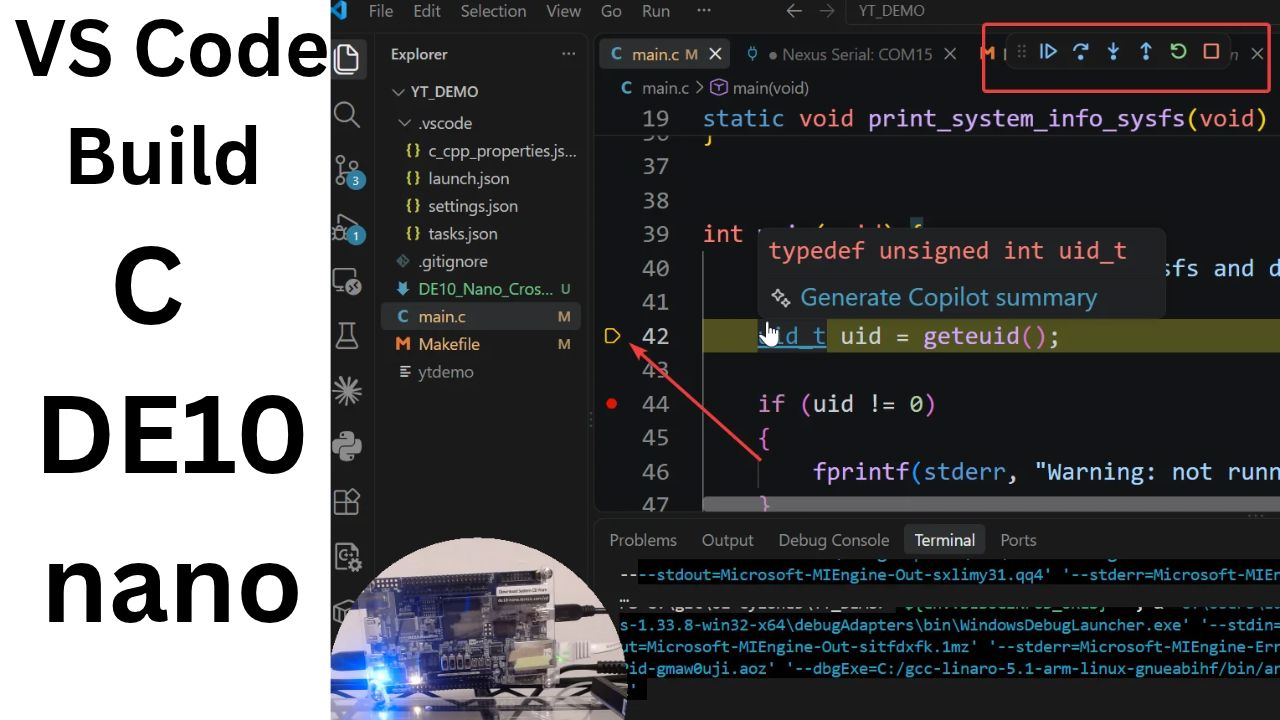
Story Hook
Picture this: you just got your hands on a DE10-Nano — that little blue board with an FPGA on one side and a full ARM Linux computer on the other. You write a simple "Hello World" in C, hit compile… and it fails. Or worse — it "compiles," you copy it to the board, and it just crashes with no explanation.
Here's the problem nobody tells you when you start embedded Linux development: your laptop and your board don't speak the same machine language. Your Windows PC has an Intel or AMD x86 processor. The DE10-Nano has an ARM Cortex-A9 sitting inside its Cyclone V chip. A program compiled for one will not run on the other — full stop. So how do real embedded engineers build software on a fast Windows machine, but run it on a tiny ARM board?
The answer is a technique called cross-compilation, paired with remote
deployment and remote debugging. And in this post, we're not just going to
talk about it — we're going to walk through an actual, working project: a small C program that reads
system information off a DE10-Nano, a Makefile that cross-compiles it, and a full Visual Studio Code
setup that builds it, ships it to the board, and lets you debug it live, breakpoints and all, without
ever leaving your laptop. By the end you'll understand exactly how every piece — the Makefile,
tasks.json, launch.json, and settings.json — fits together, and
why each strange-looking line in them exists.
Here's the video walkthrough of the same setup, if you'd rather watch it built end to end:
What the DE10-Nano Actually Is
The DE10-Nano is a development board built around an Intel (formerly Altera) Cyclone V SoC — "SoC" meaning "System on Chip." That chip is special because it's really two things fused onto one piece of silicon:
- An FPGA fabric — programmable hardware logic, great for custom digital circuits.
- A Hard Processor System (HPS) — a real ARM Cortex-A9 CPU running actual embedded Linux, with RAM, a filesystem, and USB/Ethernet.
For this walkthrough, we only care about the HPS side. As far as our C program is concerned, the DE10-Nano is just a small ARM Linux computer we can SSH into, copy files onto, and run programs on.
Why You Can't Just Compile Normally
When you run gcc main.c -o myprogram on your Windows or Linux desktop, gcc
compiles that code into machine instructions for the CPU you're running on — x86_64. Those
instructions are physically incompatible with an ARM chip. ARM and x86 have completely different
instruction sets; it's like writing a letter in French and handing it to someone who only reads
Japanese.
So we need a cross-compiler: a compiler that runs on your host machine (x86 Windows)
but outputs machine code for a different target architecture (ARM). In this project
that cross-compiler is the Linaro GCC 5.1 toolchain, specifically the
arm-linux-gnueabihf variant. That name isn't random:
arm— target CPU architecture.linux— target operating system.-
gnueabihf— GNU EABI, hard-float, meaning the compiled code uses the ARM chip's dedicated floating-point hardware instead of slower software emulation.
So the actual compiler binary is arm-linux-gnueabihf-gcc.exe — the same GCC you know, just
aimed at a different destination.
The Makefile — Automating the Cross-Compile
Typing that long compiler path and all its flags by hand every time would get old fast. That's what a
Makefile is for — a recipe file that make reads to know how to build your
project. Here's what ours does, piece by piece:
TOOLCHAIN := C:/gcc-linaro-5.1-arm-linux-gnueabihf
CC        := $(TOOLCHAIN)/bin/arm-linux-gnueabihf-gcc.exe
CFLAGS    := -Wall -Wextra -g -O0
BIN := ytdemo
SRC := main.cTOOLCHAINandCCpoint at our cross-compiler.-
CFLAGSsets compiler flags:-Wall -Wextraturn on extra warnings (catch bugs early),-gincludes debug symbols (so a debugger can map machine code back to your source lines — critical for later), and-O0disables optimization, which keeps the compiled code's structure close to your original source, making it far easier to step through in a debugger. BINis the output file name,SRCis our source file.
Then the actual build rule:
$(BIN): $(SRC)
	$(CC) $(CFLAGS) $^ -o $@
Read this as: "To build ytdemo, it depends on main.c. Do that by running the
cross-compiler with our flags on the source, output to ytdemo." $^ and
$@ are Make's shorthand for "all dependencies" and "the target name" — small syntax, but
it means you never have to retype filenames.
One extra detail worth noticing: the Makefile defines RM using cmd /c del /q /f
instead of the usual Unix rm. That's because this build runs through
mingw32-make on Windows, which executes commands directly rather than through a Unix shell
— so it needs a Windows-native delete command for make clean to work.
The C Program — What It Actually Does
Our test program is intentionally simple, but it teaches a real embedded-Linux concept: checking privileges and reading system information the "Linux way."
uid_t uid = geteuid();
if (uid != 0) {
    fprintf(stderr, "Warning: not running as root...\n");
}
geteuid() returns the effective user ID of the running process. On Linux,
user ID 0 is always root, the superuser. Many low-level operations on an
embedded board — reading /dev/mem directly, or certain files under /sys —
require root permissions. Rather than silently failing later, this program checks up front and warns
you if it's not running as root. That's a habit worth adopting in your own embedded code: fail loud and
early, not mysteriously later.
Next, the program calls uname():
struct utsname uts;
uname(&uts);
printf("System Name: %s\n", uts.sysname);
printf("Node Name: %s\n", uts.nodename);
printf("Release: %s\n", uts.release);
printf("Version: %s\n", uts.version);
printf("Machine: %s\n", uts.machine);
uname() is a standard POSIX system call that asks the Linux kernel directly for
identifying information: the OS name (sysname, almost always "Linux" here), the hostname
(nodename), the kernel release and build version, and the CPU architecture
(machine — on our board this should print something like armv7l, confirming
we really are running on ARM). This is what the comment in the code calls "sysfs-based reporting" — a
nod to the broader Linux convention of exposing kernel and hardware info through virtual files and
system calls rather than proprietary APIs.
It's a small program, but notice what it's really demonstrating: how to sanity-check, at runtime, that your cross-compiled binary landed on the right kind of machine and is running with the permissions it needs. That's a pattern you'll reuse in nearly every embedded Linux project.
Getting the Binary onto the Board: Deployment
Compiling gives us an ARM binary sitting on our Windows machine. It's useless there — we need it
on the DE10-Nano. That's a job for scp (secure copy), which works over the same
SSH protocol you'd use to remotely log into a machine.
"command": "scp",
"args": [
  "-o", "StrictHostKeyChecking=accept-new",
  "${config:bin}",
  "${config:user}@${config:host}:${config:remoteDir}/${config:bin}"
]
Read the args as one command: scp ytdemo root@192.168.0.83:/home/root/ytdemo. It copies
our compiled binary from the local project folder straight into /home/root/ on the board,
over SSH, authenticated as the root user. The
StrictHostKeyChecking=accept-new flag tells SSH "if this is a host I haven't seen before,
just trust it and remember it" — convenient for a dev board on your local network, though on a
production or internet-facing system you'd want stricter host verification.
Remote Debugging: gdbserver and cross-gdb
Here's the part that feels like magic the first time you see it: setting a breakpoint on your laptop, and having execution actually pause on the ARM board, while you inspect variables from VS Code.
This works through a client-server debugging model:
-
gdbserverruns on the board. It's a small program whose only job is to launch (or attach to) your binary, control its execution, and expose that control over a network port. -
cross-
gdbruns on your host machine. This isn't your normal desktopgdb— it'sarm-linux-gnueabihf-gdb.exe, a debugger built to understand ARM instructions and registers, even though it's running on an x86 PC.
The two talk to each other over TCP. In our task file:
ssh root@192.168.0.83 "chmod +x /home/root/ytdemo && exec gdbserver --once :2345 /home/root/ytdemo"
This SSHes into the board, makes sure the binary is executable, then starts gdbserver,
telling it to listen on port 2345 and, once a debugger connects, run ytdemo.
The --once flag means it serves exactly one debugging session then exits — clean and
simple for development use.
Meanwhile, launch.json configures the host-side cross-gdb to connect:
{ "text": "target remote 192.168.0.83:2345" }That single line is the moment the two machines link up: your local cross-gdb takes control of the remote process's execution, over the network, as if it were running locally.
Tying It Together with VS Code: tasks, launch, and settings
Rather than running make, then scp, then ssh, then
gdb by hand every single time, this project wires them into VS Code's task
system, chained by dependsOn:
build → deploy → gdbserverbuildrunsmingw32-make.exe, invoking our Makefile.-
deploydepends onbuild, and runs after it succeeds — that's ourscpstep. -
gdbserverdepends ondeploy, and starts the remote debug listener. It's marked"isBackground": truebecause, unlike a normal task that finishes and returns control, this one keeps running (listening) — VS Code needs to know not to wait for it to "complete" in the usual sense, but instead watch its output for a signal that it's ready. That's what thebackground.beginsPattern/endsPatternblock does — it watches gdbserver's log output for the phrase"Listening on port"to know the server is ready for a debugger to attach.
Then launch.json is set so its preLaunchTask is "gdbserver" —
meaning pressing F5 in VS Code triggers that entire chain automatically:
build, deploy, start gdbserver, then attach cross-gdb, then stop at main(). One keypress,
four steps.
Two subtle but important details buried in launch.json's comments are worth calling out,
because they're common sources of confusing errors for beginners:
-
"targetArchitecture": "arm"is mandatory. Older debugger back-ends (this setup uses a fairly old Linaro GDB 7.10) don't always auto-detect the target architecture reliably. Without this explicit setting, VS Code's debug tooling can default to assuming x86_64, and stepping through code will fail with confusing errors. -
Forward slashes, not backslashes, in paths passed to gdb. Even on Windows, paths
like
-file-exec-and-symbols C:/git/.../ytdemomust use/. This particular older GDB build doesn't handle Windows-style backslashes correctly in these commands — small detail, big headache if you don't know it going in.
Finally, settings.json is the single source of truth for every path and value both other
files reference through ${config:xxx} syntax — the toolchain path, the binary name, the
board's IP address, the remote directory, and the debug port. Change the board's IP once, in one file,
and both tasks.json and launch.json automatically pick up the new value. This
is a really important pattern in any config-driven project: never hardcode the same value in
multiple places — centralize it, and reference it everywhere else.
Key Takeaways
-
Cross-compilation is non-negotiable. Host and target have different instruction
sets; you build on x86 and target ARM with a toolchain like
arm-linux-gnueabihf-gcc. -
Deployment is just SSH.
scpmoves the binary; the board is "just a Linux machine on the network" from your editor's point of view. -
Remote debugging is client-server.
gdbserveron the board, cross-gdb on the host, talking over TCP — breakpoints and variable inspection work exactly as if the code were local. -
VS Code chains it into one keypress.
dependsOnlinks build → deploy → gdbserver, andpreLaunchTaskmakes F5 run the whole pipeline. -
Centralize your config. One
settings.jsonholds every path, IP, and port; everything else references it. Change it once, and the whole toolchain follows.